


Google Chartsの使い方
Vue Google Chart 2 This article explains how to use Google Charts with Vue. It also introduces how to specify the background color and graph color. The example code shows how to create a line chart with two data series and specify the line color and background color.
by JanitorSep 26, 2023

Jump Links
1. vue-google-chartsのインストール
2. Vueを作成
3. 動作確認
Google ChartsをVueで使う方法の記事です。とても簡単にデータの追加、背景色、グラフの色の指定が可能でした。
Google ChartsをVueで使う方法の記事です。とても簡単にデータの追加、背景色、グラフの色の指定が可能でした。
1. vue-google-chartsのインストール
1. vue-google-chartsのインストール
下記のコマンドを実行します。
下記のコマンドを実行します。
npm install vue-google-charts
npm install vue-google-charts
2. Vueを作成
2. Vueを作成
下記のようなソースコードで確認ができました。
下記のようなソースコードで確認ができました。
<script setup>
import { GChart } from 'vue-google-charts';
var chartType = 'LineChart'; // 折れ線グラフを指定
var chartOptions = {
title: 'Company Performance',
curveType: 'function',
legend: { position: 'bottom' },
width: 500,
height: 310,
colors: [ '#e0440e', '#f6c7b6' ], // 線の色
backgroundColor: '#E4E4E4', // 背景色
};
// 表示データ
var chartData = reactive( { value: [
['Year', 'Sales', 'Expenses'],
['2004', 1000, 400],
['2005', 1170, 460],
['2006', 660, 1120],
['2007', 1030, 540],
] } );
var addData = () => {
var addYear = String( Number( chartData.value[ chartData.value.length - 1 ][ 0 ] ) + 1 );
chartData.value.push( [ addYear, 9999, 999 ] );
}
</script>
<template>
<GChart :type="chartType" :data="chartData.value" :options="chartOptions"
class="mb-3"/>
<VBtn @click="addData" style="width: 500px;">
Add data
</VBtn>
</template>
GChartをimportして、template内にGChartタグを置いています。script setup内で用意した、タイプ、データ、オプションをGChartのプロパティとして与えています。ボタンはデータの追加の動作を確認するために配置しています。オプションで、線の色とグラフ領域の背景色の指定が可能なようです。
参考にさせて頂いたウェブサイトURL
https://codesandbox.io/s/vue-google-chart-9h8k1t?file=/src/components/google-chart/GoogleChartData.js:13-37
https://stackoverflow.com/questions/8808100/google-chart-background-color


3. 動作確認
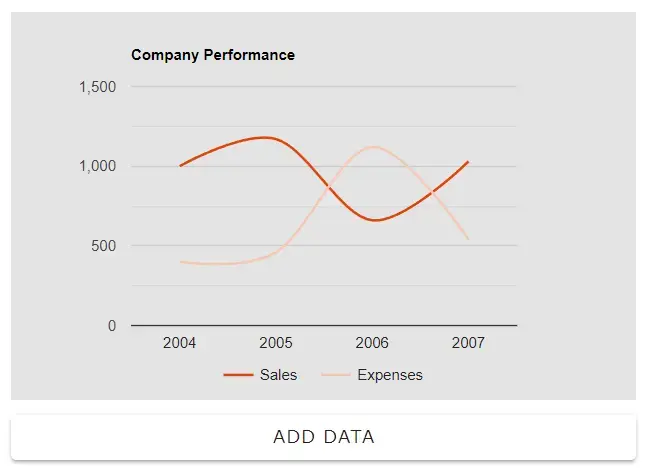
3. 動作確認
yarn devしてアクセスすると下の画像のような表示となります。
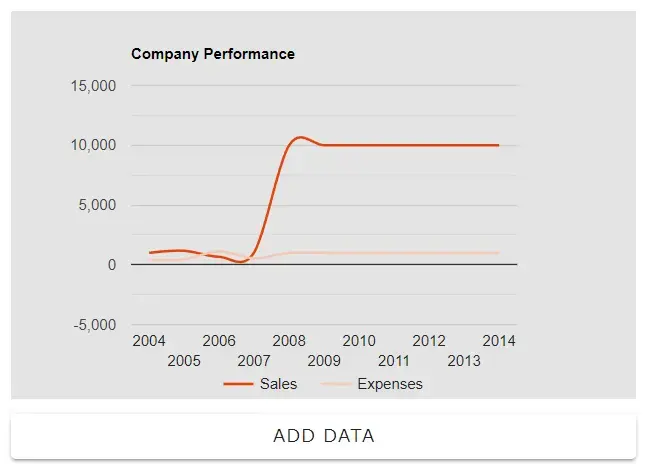
yarn devしてアクセスすると下の画像のような表示となります。
「ADD DATA」ボタンを押すと下の画像となり、データが追加できていることがわかります。
「ADD DATA」ボタンを押すと下の画像となり、データが追加できていることがわかります。
Editors pick
Our other articles


Google Chartsの使い方
Vue Google Chart 2 This article explains how to use Google Charts with Vue. It also introduces how to specify the background color and graph color. The example code shows how to create a line chart with two data series and specify the line color and background color.
by JanitorSep 26, 2023
Jump Links
1. vue-google-chartsのインストール
2. Vueを作成
3. 動作確認
Google ChartsをVueで使う方法の記事です。とても簡単にデータの追加、背景色、グラフの色の指定が可能でした。
Google ChartsをVueで使う方法の記事です。とても簡単にデータの追加、背景色、グラフの色の指定が可能でした。
1. vue-google-chartsのインストール
1. vue-google-chartsのインストール
下記のコマンドを実行します。
下記のコマンドを実行します。
npm install vue-google-charts
npm install vue-google-charts
2. Vueを作成
2. Vueを作成
下記のようなソースコードで確認ができました。
下記のようなソースコードで確認ができました。
<script setup>
import { GChart } from 'vue-google-charts';
var chartType = 'LineChart'; // 折れ線グラフを指定
var chartOptions = {
title: 'Company Performance',
curveType: 'function',
legend: { position: 'bottom' },
width: 500,
height: 310,
colors: [ '#e0440e', '#f6c7b6' ], // 線の色
backgroundColor: '#E4E4E4', // 背景色
};
// 表示データ
var chartData = reactive( { value: [
['Year', 'Sales', 'Expenses'],
['2004', 1000, 400],
['2005', 1170, 460],
['2006', 660, 1120],
['2007', 1030, 540],
] } );
var addData = () => {
var addYear = String( Number( chartData.value[ chartData.value.length - 1 ][ 0 ] ) + 1 );
chartData.value.push( [ addYear, 9999, 999 ] );
}
</script>
<template>
<GChart :type="chartType" :data="chartData.value" :options="chartOptions"
class="mb-3"/>
<VBtn @click="addData" style="width: 500px;">
Add data
</VBtn>
</template>
<script setup>
import { GChart } from 'vue-google-charts';
var chartType = 'LineChart'; // 折れ線グラフを指定
var chartOptions = {
title: 'Company Performance',
curveType: 'function',
legend: { position: 'bottom' },
width: 500,
height: 310,
colors: [ '#e0440e', '#f6c7b6' ], // 線の色
backgroundColor: '#E4E4E4', // 背景色
};
// 表示データ
var chartData = reactive( { value: [
['Year', 'Sales', 'Expenses'],
['2004', 1000, 400],
['2005', 1170, 460],
['2006', 660, 1120],
['2007', 1030, 540],
] } );
var addData = () => {
var addYear = String( Number( chartData.value[ chartData.value.length - 1 ][ 0 ] ) + 1 );
chartData.value.push( [ addYear, 9999, 999 ] );
}
</script>
<template>
<GChart :type="chartType" :data="chartData.value" :options="chartOptions"
class="mb-3"/>
<VBtn @click="addData" style="width: 500px;">
Add data
</VBtn>
</template>
GChartをimportして、template内にGChartタグを置いています。script setup内で用意した、タイプ、データ、オプションをGChartのプロパティとして与えています。ボタンはデータの追加の動作を確認するために配置しています。オプションで、線の色とグラフ領域の背景色の指定が可能なようです。
参考にさせて頂いたウェブサイトURL
https://codesandbox.io/s/vue-google-chart-9h8k1t?file=/src/components/google-chart/GoogleChartData.js:13-37
https://stackoverflow.com/questions/8808100/google-chart-background-color
GChartをimportして、template内にGChartタグを置いています。script setup内で用意した、タイプ、データ、オプションをGChartのプロパティとして与えています。ボタンはデータの追加の動作を確認するために配置しています。オプションで、線の色とグラフ領域の背景色の指定が可能なようです。
参考にさせて頂いたウェブサイトURL
https://codesandbox.io/s/vue-google-chart-9h8k1t?file=/src/components/google-chart/GoogleChartData.js:13-37
https://stackoverflow.com/questions/8808100/google-chart-background-color
3. 動作確認
3. 動作確認
yarn devしてアクセスすると下の画像のような表示となります。
yarn devしてアクセスすると下の画像のような表示となります。
「ADD DATA」ボタンを押すと下の画像となり、データが追加できていることがわかります。
「ADD DATA」ボタンを押すと下の画像となり、データが追加できていることがわかります。
Editors pick
Our other articles